Rent. It keeps going up, doesn't it? Well, not always.
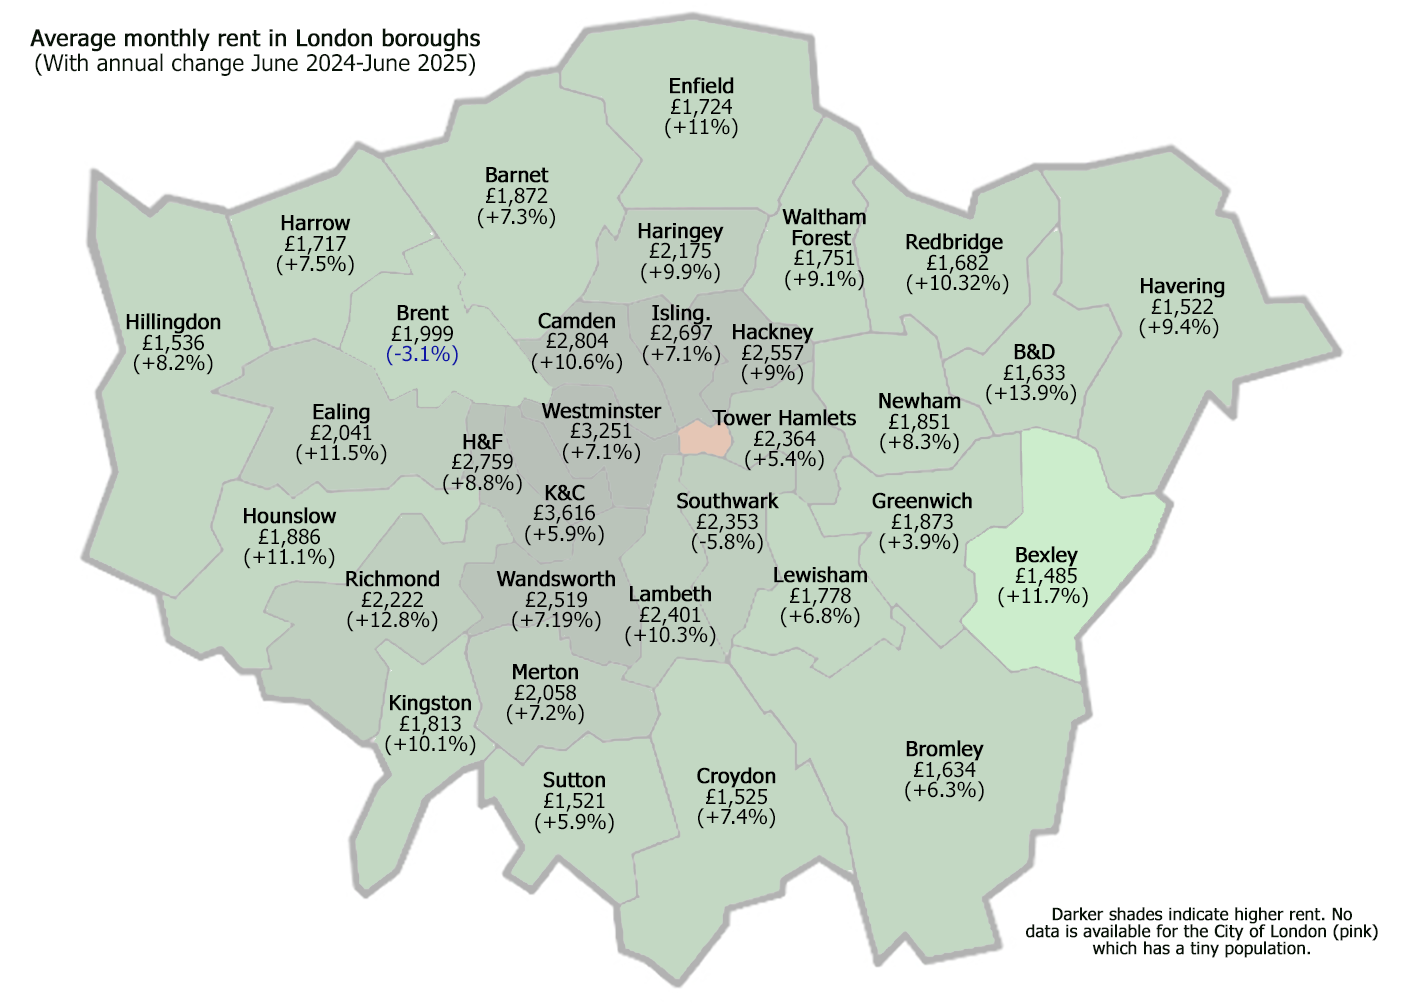
Over the past year, the average rental price has increased in 31 of London's 32 boroughs. But not in Brent. This borough alone has seen a drop in agreed rental price, down 3.1% on the June 2024 figure. Ironic, really, given that you can't spell Brent without rent.
Across the whole of London, rents have gone up 7.3% in one year, and now stand at an average of £2,252.
The figures, from the July 2025 release by the Office of National Statistics (ONS), reinforce what everyone already knows: London is an expensive place to live. The most spendy borough of all is, unsurprisingly, the Royal Borough of Kensington and Chelsea, where renters must find an average £3,616 per month. This is the most expensive place to rent in the UK. Westminster is not far behind, on £3,251 per month.
The cheapest borough, meanwhile, is Bexley, where the average rent is less than half that of K&C's at £1,485. This is still greater than the national average, which stands at £1,344.
It should be noted that these prices are averaged across all property types, from the smallest studio flat to a multi-roomed town house. In K&C, for example, a one-bed flat costs a 'mere' £2,566 a month. Shift over to Bexley, and you can enjoy a one-bed rental at an average price of £1,183 per month.
Now the good news. While rents are continuing to go up in almost all boroughs, the rate is slowing down. The ONS has now recorded drops over seven successive months. Rent is still going up, but not as fast as it was last year.
We'll update this article quarterly with fresh data.