
Click type of crime to adjust graph settings, or view a static version.
Much like yesterday's post looking at whether the numbers of police have gone up or down, Boris and Ken's camps are yelling at each about whether crime is up or down. Boris says it's down. Ken says it's up.
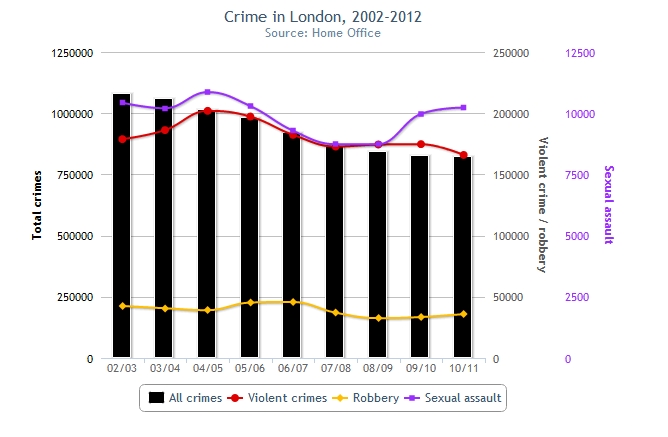
This one's harder to get to the bottom of because of a lack of raw year-on-year statistics. The Metropolitan Police (Met) moved to a rolling 12 month system in 2009, which means they stopped carrying historical data. The Home Office has some stats but the categories are very broad. The table above is an amalgamation of data we cobbled together from both sources and shows a general downward trend with a slight uptick in robbery and sexual assault last year. If you hover over the columns you can see the precise figures.
The statistics Boris's team are using seem to come from the Police and Crime Committee's reports, the latest from March 2012 (PDF). These compare two blocks of 45 month periods – the 45 months immediately prior to now, and the 45 months before that. In other words, the last two Mayoral terms. But as we can see above, when the general trend is downwards, using that method can be quite misleading.
A couple of weeks ago a missive from Ken's campaign popped through our letterbox. Robberies, rape, murder and knife crime are all up over the last two years, it declared. On robbery and rape, that's true. On knife crime, we wish we could bloody tell you but figures specifying knife crime apart from other violent crimes aren't readily available (we're trying to track them down). On murder, the numbers involved were too small to fit into the chart so here they are:
Murder statistics:
2002/2003: 189
2003/2004: 204
2004/2005: 182
2005/2006: 168
2006/2007: 162
2007/2008: 156
2008/2009: 146
2009/2010: 120
Feb 2010-Feb 2011: 137 (there's overlap with financial year 2009/2010; this is the problem with using two different datasets)
Feb 2011-Feb 2012: 104
Based on these numbers (from the Met and Home Office again), murder is down.
This might seem small beer, but messing about with crime statistics has a knock-on effect to how safe we feel. It's well documented through the British Crime Survey that our perception of crime is worse than reality. You can see what crime is like in your local area by using the Met's crime maps.
Infographic by Dean Nicholas


