

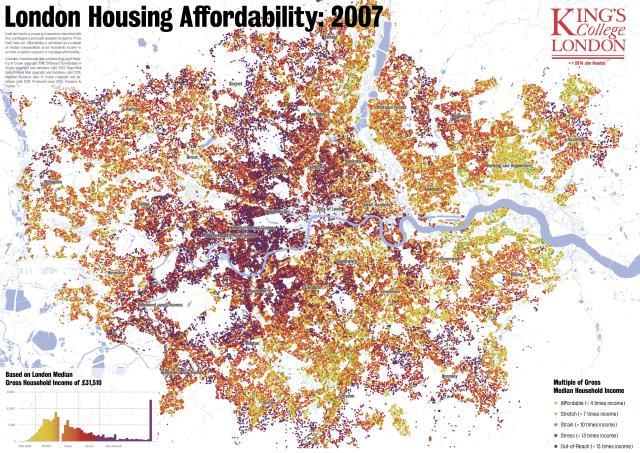


If you're looking to buy your first home, you might not want to look at these maps. Created by Jon Reades of King's College London, they plot property transactions recorded through the Land Registry for 1997, 2002, 2007 and 2012. The colours show how affordable each property was based on multiples of London's median gross household income for each year: up to 4x is green and considered affordable, purple is more than 13x and out of reach.
A paper by Jon and colleague Chris Hamnett looked at how housing affordability has changed over time. For first time buyers in London, the house price to earnings ratio (based on mean gross earnings) peaked at 5.8 during the boom of the late 1980s; in the first quarter of this year, it reached 8 times income. The affordability ratio in the commuter belt, South East and South West is currently around 5.5, whereas in the North East it's 3.2 They point out that in 1997, illustrated on the map:
large parts of London were still quite affordable for middle-income households. The 2012 map — based on the last full year for which good household income data is available — demonstrates how dramatically this has changed: apart from the outer bits of the East End, first-time buyers will struggle to find a foothold, however marginal, on the property ladder. London has been hollowed out in terms of affordability."
Bearing in mind that it's almost impossible to find anything for sale in London under £200k, that would be 5.5 times the gross median income, and 10 times income of the lowest earning 40% of households (these figures are based on 2012/2013 figures, the most recent data available). "For a bare bones £200,000 property to be considered affordable using the historical definition of three to four times gross income," they say, "a household needs to be taking in nearly £60,000 a year."
If you're interested in London's housing crisis, or want to examine these maps in more detail, sign up for a free event on Wednesday 5 November at King's College (6.30pm start). Speakers are Neal Hudson, oft-quoted research analyst at Savills; Tottenham MP David Lammy; Toby Lloyd, Head of Policy at Shelter; David Lunts, Greater London Authority Executive Director of Housing and Land; and Professor Christine Whitehead, housing economist at the LSE.


